
“ We are often asked by clients whether they should Grow, Grow, Grow or focus efforts on cutting some costs. Is it time to add another mid-level or bring in another provider. This article below provides an interesting perspective on that often asked question, should I expand, add providers, bring in more ancillary services? It is a difficult and complex question with no easy response, but we have found similar results to David’s findings” - Jeff Robertson
By David N. Gans, MSHA, FACMPE
Almost universally, practice leaders agree that among their primary goals is to ensure long-term financial stability for their organizations by maximizing bottom-line revenue after expenses. While leaders may agree on the goal, they and their staff often clash on how to get there. These executives face a dilemma: Should the practice focus on cost efficiency by reducing operating cost to the bare minimum or should it take Civil War Adm. David Farragut’s advice to “Damn the torpedoes, full speed ahead” and maximize revenue regardless of what it costs to do so?
There are advocates for each strategy, and there is even anecdotal evidence for an approach that attempts to balance total operating cost and total revenue. However, just as medicine is based on the scientific method and demonstrated efficacy, evidence-based management looks to data to evaluate alternative courses of action. The Enterprise version of the MGMA DataDive Pro Cost and Revenue 2016 features the new quartile report that provides some clarity on this question. The report allows the user to select a key benchmark and then partitions the survey’s other metrics into the benchmark’s quartile groupings.
Examining the chart (Figure 1, below), we see three alternative strategies and their effect on practice performance:
- Minimize costs using the first quartile for total operating cost per full-time-equivalent (FTE) physician as the benchmark
- Maximize revenue with the benchmark being the fourth quartile for total medical revenue per FTE physician
- Optimize cost-efficiency using the first quartile for total operating cost as a percent of total medical revenue as the benchmark
The chart provides some clarity to the debate, reporting performance for the practices in the target quartile. It’s almost too obvious that the practices that maximized revenue reported the highest median total medical revenue per FTE physician, the ones that reported lowest cost had the least total operating cost per FTE physician, and the practices that were cost efficient were in between.
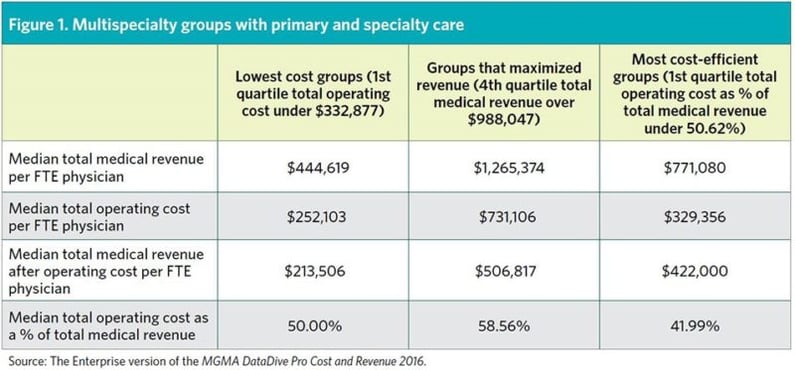
However, the chart also shows the “bottom line” metric, median total medical revenue after operating cost per FTE physician, where we see a difference in performance. The practices that focused on minimizing costs unfortunately appear to have starved production, resulting in a low level of revenue and, even with the least cost, the worst bottom line of the three strategies.
The practices that maximized revenue reported a median total medical revenue per FTE physician that was almost three times greater that the medical groups that minimized costs and, even with costs also being three times greater, reported a bottom line — median total medical revenue after operating cost per FTE physician — that was 237% greater.
The practices that were the most efficient in balancing costs and revenues to obtain the lowest overhead percentage did well, but not quite as well as the medical groups that maximized revenue. For these groups, while total medical revenue per FTE physician was only 61% of that reported by the practices that maximized revenue, their total operating cost per FTE physician was only 45% of these practices, and they achieved a bottom line that was 83% of that reported by the practices that maximized revenue.
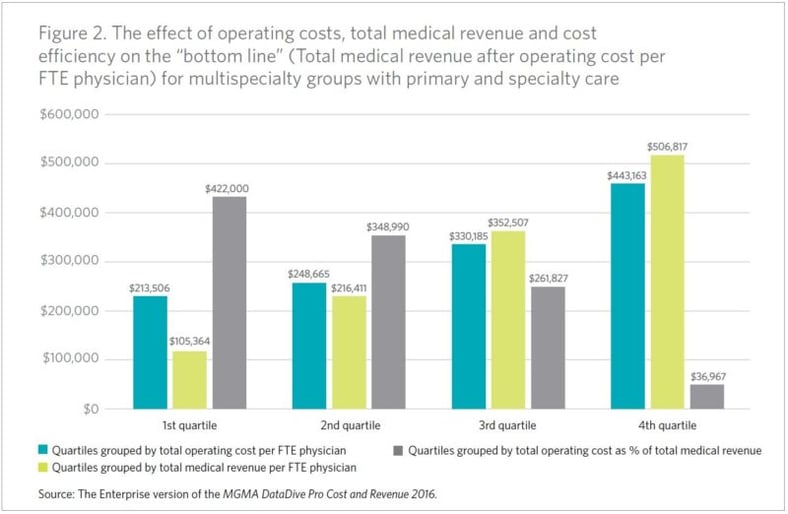
The graph (Figure 2, above) provides further insights into the effect on the bottom line of each strategy. As operating costs increase for the benchmark (total operating cost per FTE physician) the amount of revenue after operating costs per physician increases almost proportionally. While this may at first glance appear counterintuitive, as costs increase there is also an increase in total medical revenue per FTE physician. The practices with the greatest costs also have the greatest revenue, suggesting investment — whether in personnel, resources or technology — has the potential to pay off.
The graph also shows a direct relationship of greater revenue to a greater bottom line and, most importantly, what occurs when costs and revenue are not balanced. In this last instance, we see how as the total operating cost as a percent of total medical revenue increases, the bottom line shrinks. In the fourth quartile for this metric, practices that reported total operating costs as a percent of total medical revenue of 74.64% or greater, reported an almost nonexistent amount of revenue after operating cost. The underlying data set found that, after further paying provider compensation and benefits, these medical groups reported an overall operating loss of -$197,187.
Administrators are often evaluated on the ability to control costs and having low overhead frequently confers bragging rights of being a good manager. However, if the intention is to maximize profits, the data show something different. Efficiency is a good strategy, but not necessarily the one that yields the maximum benefit. Based on the evidence, practice managers that want to maximize profits may want to “damn the torpedoes” and break from the mindset of the lowest costs translating into the best possible bottom line.


